The Cohort Report is designed for higher-level data analysis. It is aimed at headteachers, senior leaders and data managers who need to quickly identify trends in attainment and progress data, over multiple subjects and across year groups.
All data is analysed in terms of cohort including Boys, Girls, Pupil Premium, SEN, Disadvantaged and ethnicity. It is also possible for schools to set up their own Groups e.g. ‘Home Grown’, ‘Low/Middle/High’ or ‘Intervention Groups’ (see ‘How to set up classes and groups‘ and ‘Ways to use Prior Attainment in Pupil Asset’ ).
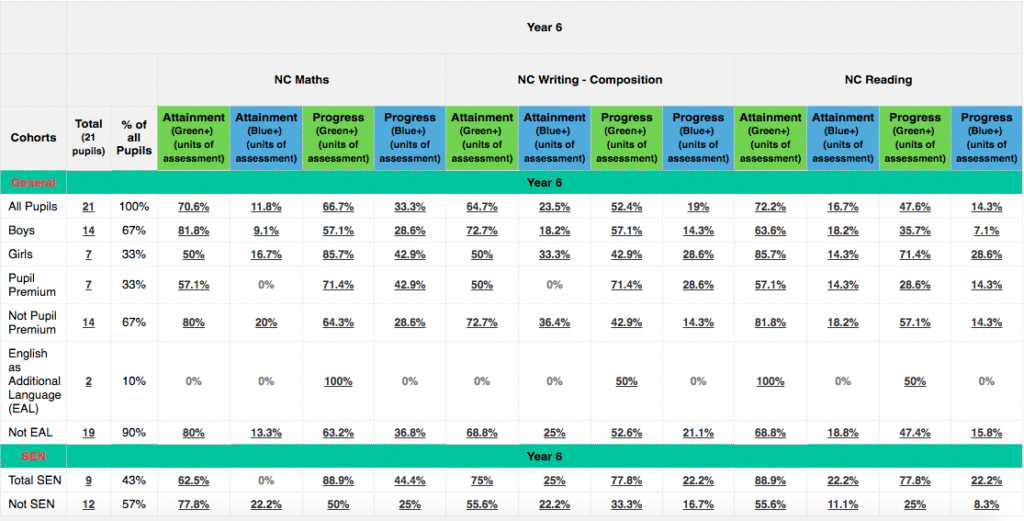
The Cohort Report offers schools a wide range of choice in terms of how to present attainment and progress data, including as a grade, point score, value-added measure or percentage of children meeting a particular threshold. The Pupil Asset Colour Key quickly highlights areas of strength and weakness, whilst the presentation of cohorts enables easy comparison.
By clicking on a particular statistic within the Cohort Report, users can explore the details behind the numbers. This includes finding out which pupils did and did not reach the expected standard and by how much. Once school-level patterns of strength and weakness have been evaluated, pupils in need of further support can quickly be identified and interventions put in place. Changes in subsequent Cohort Reports can then demonstrate impact and closing the gap.
How to configure the Cohort Report
Navigate to Analysis > Cohorts.
Select the year group or groups you want to report on using the Filter. Note, however, that certain progress ranges are not available in Whole School filtering. In these cases reports will need to be generated for each year group separately.
Configure the rest of the report using the Display Options.
ADD ROWS
This section allows you to select which cohorts you wish to add to the report. Cohorts are selected from broader categories e.g. General or Special Needs. Click MORE and select the specific cohorts you want to include in the report. You can then press LESS to collapse that filter.
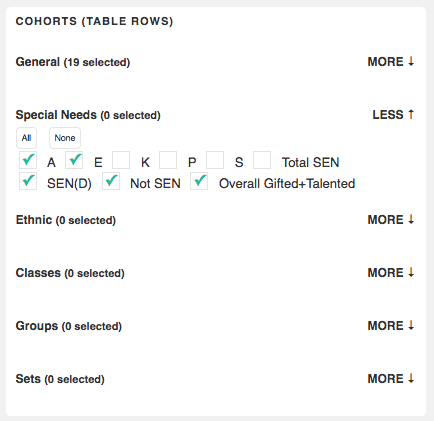
General – DfE defined groups such as Pupil Premium, LAC and Ever6
Special Needs – The different stages of the graduated approach from SEN Support (K), to EHCP (E). This also includes G&T as an option.
Ethnic Groups – Range of ethnicities represented in your school.
Classes – The different classes within a year group, phase or school.
Sets – The different sets within a year group, phase or school.
School Groups – Any school-specific groups. Groups specific to a school need to be set up under Pupils > Groups (see ‘How to set up classes and groups‘ ).
ADD GENERAL AND SUBJECT COLUMNS
This section will allow you to select the subjects you want to report on and how you wish to view the data. It will also allow you to add more contextual data such as attendance.
Number on roll – Number of learners in each cohort.
Percentages – Express the group as a percentage of the total pupils in the Filter.
Attendance (selected term) – An average percentage of attendance for the cohort for the term selected under Attainment Averages (see below).
Attendance (annual) – An average percentage of attendance for the Cohort for the academic year.
Behaviour – An average behaviour score for the Cohort, expressed as a -3 to +3 score. You will need to be tracking behaviour with Pupil Asset’s built-in Behaviour tracker for this field to populate.
ADD ATTAINMENT COLUMNS
This section allows you to select the subjects and term you want to report on and how you wish to view attainment.
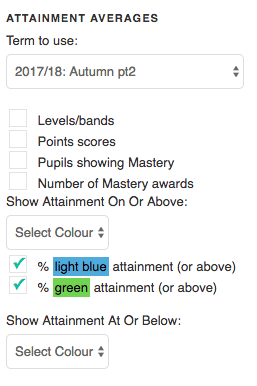
Levels/bands – The average level, band or grade achieved by the cohort.
Points scores – The average Pupil Asset point score achieved by the cohort.
Attainment on or above – Choose a colour to show the % of learners who have attained at or above that colour e.g.
% blue attainment (or above) – The % of learners whose attainment is light blue (or higher) for the term selected i.e. Above Expected or above.
% green attainment (or above) – The % of learners whose attainment is light green (or higher) for the term selected i.e. Expected or above.
Attainment on or below – Choose a colour to show the % of learners who have attained at or below that colour e.g .
% yellow attainment (or below) – The % of learners whose attainment is orange (or lower) for the term selected .
Pupils showing Mastery – The number of pupils who achieved at least 1 Mastery sticker in the term selected.
Number of Mastery awards – The number of Master stickers given in the term selected.
ADD PROGRESS COLUMNS
This section allows you to choose how you wish to view progress and what range to use.
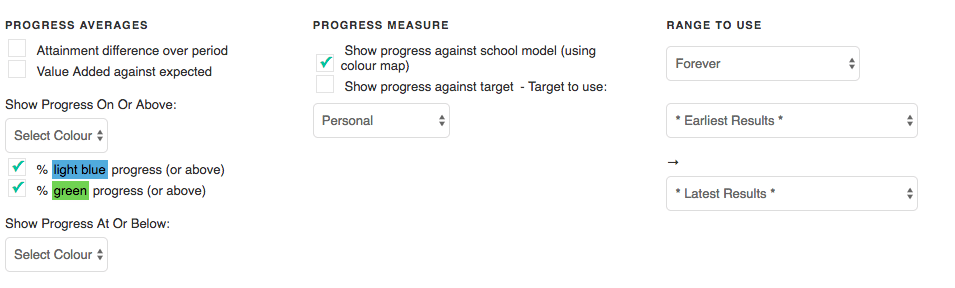
Value Added against expected – the number of Colour Bands/Units of Assessment/Points above or below what was Expected, expressed as an average for the cohort.
Attainment difference over period – the number of Colour Bands/Units of Assessment/Points added, expressed as an average for the cohort.
Progress on or above – Choose a colour to show the % of learners who have progressed according to that colour i.e.
% blue progress (or above) – The % of learners in each cohort making more than expected progress: +2 Colour Bands/Units of Assessment/Points more than Expected.
% green progress (or above) – The % of learners in each cohort making at least expected progress: the required number of Colour Bands/Units of Assessment/Points or more.
Progress at or below – Choose a colour to show the % of learners who have progressed according to that colour i.e.
% yellow progress (or below) – The % of learners in each cohort making less than expected progress: -1 Colour Bands/Units of Assessment/Points below expected.
Range to use
Select the time period over which you wish to measure progress. Options include:
Forever – From the earliest entered to the most recently entered data.
Since last term – Progress over a term e.g. Autumn to Spring; Spring to Summer; Summer to Autumn.
Since start of year – Progress since the start of year baseline.
Since end of last year – Progress since the end of previous year.
Over previous term – Progress over previous term i.e. in June, this will measure progress from Autumn to Spring.
Over previous year – Progress over the previous academic year from baseline data entered into Start of Year to Summer (ii).
KS1 to KS2 – Progress between end of KS1 and end of KS2 results. This is based on your in-school end of Key Stage result, not specialist or external accountability data such as the Teacher Assessment columns or SATs Standardised Scores. To measure progress using these data, use a Fixed Range.
Fixed Range – Stipulate the specific columns of data between which progress is to be measured.
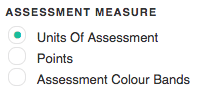
Assessment Measure
Choose the units in which you want to express the measure of progress.
FAQ:
Can I apply the Filter in the Cohort Report?
Yes – if required, the Filter can be used to isolate cohorts prior to configuring the rest of the report.
For example, you may choose to filter to Male only in which case the cohorts then incorporated in the final report will reflect this e.g. Pupil Premium Males; SEN Males; Disadvantaged Males.
NB: If you have filtered a specific year or field within the Filter, this may restrict other options. For example, if you have filtered to a specific year group, you cannot then build a whole school report.
How can I print out or export the Cohort Report?
The Cohort Report can be printed using the Print icon on the red bar (top-right of the webpage).

The download icon is the downwards arrowing pointing into a tray.